
Operating Case Studies

Operating Case Studies
Standard reports show appointments, sales, clients, and staff activity. These case studies examine what those records may mean: where revenue is leaking, where client behavior is weakening, and where operational adjustments may produce measurable value.
Calendar and Capacity
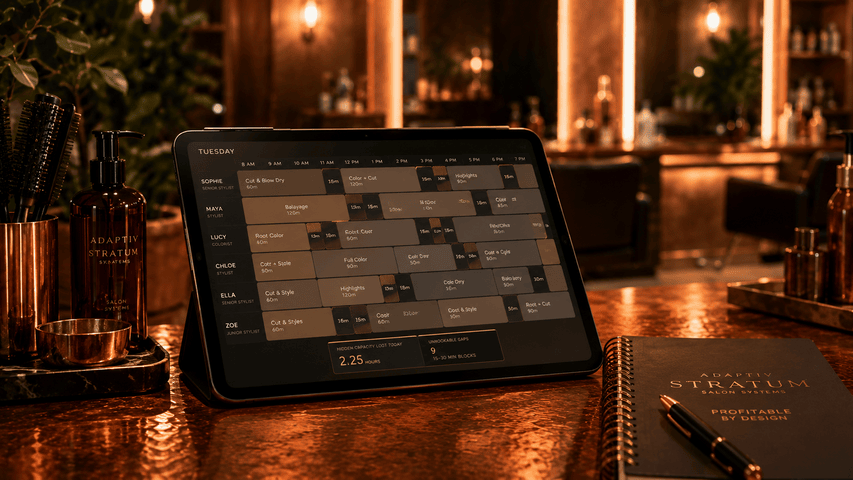
The Fully Booked Salon That Was Still Losing Capacity
Micro-gaps, service durations, and unsellable calendar time
A salon can look fully booked while still losing meaningful revenue through trapped time. This case study examines how small gaps, mismatched service durations, and excessive buffers reduce sellable capacity without appearing as obvious empty space.
The surface problem
The salon looked busy. Most providers had full calendars, the owner saw steady demand, and the appointment book rarely looked empty during peak hours.
But revenue still felt inconsistent. Some days looked full but underperformed. Some staff members appeared booked but did not produce the expected revenue. The owner could see activity, but not the operational reason behind the gap.
Standard reports showed sales, appointments, and staff totals. They did not clearly show how much sellable time was being lost inside the calendar itself.
What Adaptiv Stratum examined
Adaptiv Stratum reviewed the salon’s appointment patterns, service durations, staff schedules, booking gaps, completed services, and revenue by time block.
The goal was not to create another dashboard. The goal was to identify whether the calendar was truly full or only visually full.
- Micro-gaps between appointments
- Service durations that do not match real operating time
- Calendar inventory lost to unsellable fragments
- Schedule adjustments that may recover capacity without adding staff
The hidden issue
The calendar was not empty in an obvious way. The problem was fragmented time.
Across several providers, the salon had repeated 15- and 30-minute gaps between appointments. These gaps were too small to sell as normal services, but large enough to reduce daily capacity. They appeared harmless when viewed one at a time. Across weeks and months, they became a measurable loss of available appointment inventory.
In some cases, the gaps were caused by service durations that no longer matched the actual work. Certain services were blocked for more time than they usually required. Other services were booked too tightly, forcing staff to run late and creating defensive buffers later in the day.
The result was a calendar that looked full but contained trapped time the salon could not monetize.
Example findings
- Multiple providers had small gaps that could not realistically be sold.
- Some service durations created unnecessary dead space.
- Other services were too short, creating delays and defensive buffers.
- Peak demand hours were diluted by inefficient appointment sequencing.
- Available capacity existed, but not in a form clients could book.
Illustrative financial model
The financial impact depends on pricing, average ticket value, staff count, booking rules, and actual appointment history.
| Capacity issue | Illustrative impact |
|---|---|
| Average trapped time per provider per week | 1.5 hours |
| Number of affected providers | 5 |
| Total trapped time per week | 7.5 hours |
| Estimated revenue per sellable hour | $95 |
| Estimated weekly capacity exposure | $712.50 |
| Estimated annualized capacity exposure | $37,050 |
This does not mean every dollar can automatically be recovered. Some time may remain structurally difficult to sell, and some gaps may be necessary for reset, cleanup, consultation, or staff recovery. The value of the analysis is separating useful buffer time from preventable fragmentation.
What changed operationally
- Service durations could be reviewed against actual appointment behavior.
- Booking rules could be adjusted to reduce unusable gaps.
- Buffers could be placed where operationally necessary.
- High-demand services could be sequenced more intentionally.
- Schedules could be reviewed by sellable capacity, not visible busyness.
The salon did not need to add chairs, extend hours, or increase marketing spend before understanding whether its existing calendar was being used efficiently.
The operating lesson
A full calendar is not the same as a productive calendar.
When appointment time is fragmented into small unsellable pieces, the business can lose revenue while still appearing busy.
Adaptiv Stratum helps identify whether the salon has a demand problem, capacity problem, scheduling problem, or measurement problem.

The Tuesday Trap
Why peak weekend demand masks weekday inefficiency
A salon can feel exceptionally busy on Friday and Saturday while staff sit idle earlier in the week. This case study examines how strong weekend demand can conceal weak weekday utilization.
The surface problem
Friday and Saturday were consistently busy. Clients competed for preferred times, providers appeared fully utilized, and the salon regularly carried a weekend waitlist.
Those peak days shaped the owner’s perception of the entire business. The salon felt full because its most visible periods were full.
But Tuesday through Thursday told a different story. Several providers had long unsold blocks, appointments were spread thinly across the day, and labor capacity remained available without producing corresponding revenue.
What Adaptiv Stratum examined
Adaptiv Stratum reviewed appointment timing, provider schedules, staff availability, service mix, weekend waitlists, and utilization by day of the week and time of day.
- Utilization isolated by day and time
- Unused staff capacity during Tuesday through Thursday shifts
- Weekend demand that could potentially move to off-peak periods
- Service and provider availability by specific day
How it is measured
Appointment timing is compared against the available provider capacity blocks on the calendar. Utilization is then isolated by day, time, service, and provider instead of being blended into a single weekly percentage.
The hidden issue
Overall utilization can hide where the business is actually earning and where it is carrying unused labor.
In this composite scenario, weekend utilization exceeded 90%, while Tuesday through Thursday averaged closer to 60%. When all days were blended together, the salon appeared reasonably full. When each day was isolated, the imbalance became clear.
The salon was simultaneously rejecting some weekend demand and carrying substantial weekday capacity. It did not necessarily have a total demand shortage. It had a demand-distribution problem.
Example findings
- Friday and Saturday carried most high-value appointment demand.
- Tuesday through Thursday contained long unsold provider blocks.
- Weekend waitlists were not consistently offered weekday alternatives.
- Some services were unnecessarily restricted to peak periods.
- Staffing levels remained similar even when weekday demand was weaker.
Illustrative financial model
| Utilization issue | Illustrative impact |
|---|---|
| Friday and Saturday utilization | 91% |
| Tuesday through Thursday utilization | 60% |
| Available weekday provider hours per month | 196 hours |
| Booked weekday provider hours | 118 hours |
| Unused weekday capacity | 78 hours |
| Estimated revenue per sellable hour | $92 |
| Estimated monthly capacity exposure | $7,176 |
This is theoretical capacity exposure, not guaranteed recoverable revenue. Not all weekend clients can or will move to weekdays. The analysis identifies how much unused inventory exists and which demand segments may be flexible enough to shift.
What changed operationally
- Weekend waitlist clients could be offered specific weekday alternatives.
- Provider shifts could be aligned more closely with actual demand.
- High-demand services could be made available during underused periods.
- Client outreach could target people with historically flexible schedules.
- Utilization could be monitored by day instead of only by week.
The operating lesson
A busy weekend does not prove that the full operating week is efficient.
Adaptiv Stratum helps identify whether the salon has a total demand problem, a weekday distribution problem, a staffing alignment problem, or a booking-rule problem.
Cancellations and Recovery

The Cancellation Problem That Was Bigger Than It Looked
Unrecovered appointments and ghost revenue
A cancellation is not just a removed appointment. If the slot is not refilled, the business may lose revenue, staff productivity, and daily utilization.
The surface problem
The salon knew cancellations were happening, but they were treated as a normal part of the business. Some clients canceled early. Others canceled close to the appointment time. A few canceled repeatedly.
Standard reports showed canceled appointments as a count. They did not clearly show how much expected revenue disappeared, which slots were recovered, which stayed empty, or which cancellation patterns created the greatest exposure.
The issue was not simply that appointments were canceled. The issue was that many canceled appointments were never replaced.
What Adaptiv Stratum examined
Adaptiv Stratum reviewed canceled appointments, service values, cancellation timing, replacement bookings, waitlist activity, client history, and provider schedules.
- Canceled appointments that were never replaced
- Late cancellations with low resale probability
- Missed waitlist recovery opportunities
- Revenue exposure hidden behind cancellation counts
The hidden issue
A canceled appointment is not automatically a lost appointment. If the slot is refilled quickly, the business may recover most or all of the revenue. If it remains empty, the expected revenue disappears.
This created ghost revenue: money that was expected, scheduled, and visible in the appointment book, but never converted into completed service revenue.
The owner did not need a larger cancellation count. The owner needed to know which cancellations actually damaged the business.
Example findings
- Some appointments were canceled too late to be resold.
- High-value services had lower replacement rates.
- Providers with similar cancellation counts had different financial exposure.
- Waitlist demand did not always trigger timely outreach.
- Reports showed appointment loss but not unrecovered value.
Illustrative financial model
| Cancellation issue | Illustrative impact |
|---|---|
| Average canceled appointment value | $135 |
| Average unrecovered cancellations per month | 18 |
| Estimated unrecovered value per month | $2,430 |
| Estimated unrecovered value per quarter | $7,290 |
| Estimated annualized ghost revenue exposure | $29,160 |
This is not guaranteed recoverable revenue. Some cancellations will remain difficult to replace. The purpose is to identify where recovery is realistic and where follow-up needs to happen faster.
What changed operationally
- Late cancellations could be separated from early cancellations.
- High-value canceled slots could trigger faster waitlist outreach.
- Repeat offenders could receive stronger confirmation or deposit rules.
- Recovery could be measured by dollars, not only appointments.
- Peak-period cancellation exposure could be reviewed by provider.
The operating lesson
A cancellation is not just a blank space. It is inventory that either gets recovered or expires.
Adaptiv Stratum helps identify whether the salon has a cancellation problem, recovery problem, waitlist problem, or policy-enforcement problem.
Client Retention

The High-Value Clients Who Had Not Officially Churned Yet
Booking cadence drift and early retention risk
Standard churn reports often identify clients after they are gone. This case study looks at clients who remain active on paper while their booking rhythm and annual value begin to weaken.
The surface problem
The salon had a strong base of loyal clients. Many of the highest-spending clients were still listed as active and appeared in ordinary reports as retained.
But revenue from several top clients was weakening. They had not disappeared. They were still booking, but less often.
A client who once visited every five weeks and now waits nine weeks may still look active. Operationally, annual revenue from that client may already be falling.
What Adaptiv Stratum examined
Adaptiv Stratum reviewed client booking history, completed appointments, service patterns, average visit intervals, spend, provider relationships, and last appointment dates.
- Top clients outside their normal booking rhythm
- Frequency decay before full churn
- High-value at-risk client detection
- Outreach opportunities before the relationship is lost
The hidden issue
Standard churn reports often identify the problem too late. By the time a client is labeled inactive, several booking cycles may already have been lost.
The useful signal was whether the client had drifted outside their own historical rhythm.
Some clients who previously booked every four to six weeks were now booking every eight to ten weeks. The business did not have a client-count problem. It had a cadence problem.
Example findings
- Top-spending clients were outside their normal booking window.
- Visit frequency had stretched without triggering follow-up.
- Annual value declined while clients still appeared active.
- Service-specific clients showed different drift patterns.
- Outreach remained possible before full inactivity.
Illustrative financial model
| Retention issue | Illustrative impact |
|---|---|
| Prior client cadence | Every 5 weeks |
| New client cadence | Every 9 weeks |
| Average appointment value | $160 |
| Prior estimated annual visits | 10.4 |
| New estimated annual visits | 5.8 |
| Estimated annual value decline per client | $736 |
| Example affected high-value clients | 18 clients |
| Estimated annualized value exposure | $13,248 |
Not every client can be returned to a previous rhythm. The value is identifying which clients are drifting early enough for outreach to remain rational.
What changed operationally
- High-value clients could be monitored against their own rhythm.
- Outreach could occur before full inactivity.
- Staff could identify clients needing rebooking attention.
- Follow-up could reflect service-specific cadence.
- Seasonal variation could be separated from real retention risk.
The operating lesson
Active clients are not always stable clients.
Adaptiv Stratum helps identify whether the salon has a churn problem, cadence problem, rebooking problem, or outreach-timing problem.

The New-Client Problem Hidden Behind Strong First Visits
Third-visit conversion and onboarding leakage
New-client volume can make growth look healthy even when too many clients fail to become repeat customers.
The surface problem
The salon was attracting new clients. First-time appointments were coming in, the calendar looked active, and marketing appeared to be producing visible demand.
But growth still felt unstable. New faces arrived, yet the client base was not strengthening at the same rate.
Standard reports showed new-client volume. They did not clearly show how many became stable, repeat clients.
What Adaptiv Stratum examined
Adaptiv Stratum reviewed first completed appointments, second visits, third visits, service type, provider assignment, appointment timing, rebooking behavior, and spend after the first visit.
- First-visit volume versus durable client growth
- Second- and third-visit conversion
- New-client onboarding leakage
- Service types that attract interest but fail to retain
The hidden issue
New-client volume can make growth look stronger than it is. A business may create first visits while failing to convert enough clients into repeat relationships.
Several clients returned once but did not continue. Others never booked a second visit. Some entry services created high first visits but weak long-term retention.
The problem was not only acquisition. It was onboarding leakage.
Example findings
- First-visit volume was healthy, but third-visit conversion was weak.
- Some services attracted clients without producing durable behavior.
- Clients left without rebooking after the first visit.
- Provider-level retention varied despite similar first-visit counts.
- Follow-up timing was inconsistent.
Illustrative financial model
| New-client retention issue | Illustrative impact |
|---|---|
| New clients per month | 42 |
| Current third-visit conversion | 38% |
| Improved conversion target | 48% |
| Additional clients reaching third visit monthly | 4.2 |
| Average appointment value | $145 |
| Additional third-visit revenue monthly | $609 |
| Estimated annualized revenue lift | $7,308 |
This only counts the third visit itself. It does not include the longer-term value of clients who continue after that appointment.
What changed operationally
- New-client performance could be measured beyond first visits.
- Weak-retention entry services could be reviewed.
- Providers could be compared by new-client retention.
- Rebooking prompts could be strengthened before checkout.
- Follow-up could reflect expected service cadence.
The operating lesson
New-client traffic is not the same as client-base growth.
Adaptiv Stratum helps identify whether the salon has an acquisition problem, onboarding problem, rebooking problem, or service-fit problem.

The “I’ll Book Later” Risk
Why checkout rebooking dictates future cash flow
A client who intends to return but leaves without an appointment can unintentionally extend a six-week service cycle into eight weeks through ordinary booking friction.
The surface problem
A salon can deliver a strong service, earn the client’s trust, and fully expect that client to return. But when the client leaves checkout without another appointment, intention and behavior begin to separate.
The client may still consider themselves a six-week client. In practice, they wait, discover that preferred times are no longer available, and eventually return after eight weeks.
The client has not churned, but the salon may already be losing visits and annual revenue through ordinary booking friction.
What Adaptiv Stratum examined
Adaptiv Stratum reviewed completed appointments, checkout times, future appointment creation timestamps, return intervals, provider relationships, service history, and appointment value.
- Time between checkout and creation of the next appointment
- How ad-hoc booking affects the average return cycle
- Revenue impact when six weeks becomes eight weeks
- Rebooking behavior by provider, service, and client value
How it is measured
The creation timestamp of the next appointment is compared against the client’s previous checkout time. Average visit frequency is then calculated over a twelve-month period.
The hidden issue
A client does not need to disappear for the salon to lose value.
Clients who left without another appointment consistently took longer to return. The delay was usually not an intentional decision to visit less. It developed through small points of friction.
The client intended to book later. Later became the following week. The preferred provider or time was unavailable, and a six-week service cycle became an eight-week cycle.
The salon’s client count remained stable, but the number of completed visits per client quietly declined.
Example findings
- Pre-booked clients returned closer to normal cadence.
- Clients who waited to book had longer visit intervals.
- High-demand providers showed the greatest delay.
- Active clients completed fewer annual visits than expected.
- Provider rebooking performance varied materially.
Illustrative financial model
| Rebooking issue | Illustrative impact |
|---|---|
| Expected client return cycle | Every 6 weeks |
| Observed ad-hoc booking cycle | Every 8 weeks |
| Annual visits at a 6-week cycle | 8.7 |
| Annual visits at an 8-week cycle | 6.5 |
| Annual visits lost per client | 2.2 |
| Average appointment value | $145 |
| Example affected regular clients | 36 clients |
| Estimated annualized revenue exposure | $11,310 |
Some clients intentionally change frequency. The purpose is to distinguish deliberate cadence changes from delays associated with leaving checkout without a future appointment.
What changed operationally
- Rebooking rates could be measured by provider and service.
- Checkout staff could prioritize securing the next appointment.
- Non-prebooked clients could receive cadence-based follow-up.
- High-demand providers could encourage earlier booking.
- Annual visits could be measured instead of active status alone.
The operating lesson
Client intention does not create future revenue. A completed appointment does.
Adaptiv Stratum helps identify whether the salon has a retention problem, rebooking problem, provider-availability problem, or booking-friction problem.
Client Value and Margin

The Flat Ticket
Why loyal regulars may not be growing in value
A reliable regular supports the baseline schedule, but a client who never adds a service or purchases retail may represent a plateau in client value.
The surface problem
A loyal regular gives the salon predictable demand. They return consistently, request the same provider, and book the same core service.
But repeat visits do not always mean the relationship is growing.
When a long-term client never adds a treatment, upgrades a service, or purchases recommended retail, average ticket value can remain unchanged for years.
What Adaptiv Stratum examined
Adaptiv Stratum reviewed completed appointments, order history, service combinations, retail purchases, add-on activity, visit frequency, client tenure, and average ticket value.
- Loyal clients with no retail or add-on history
- Service mix stagnation among long-term regulars
- LTV differences between single-service and multi-service clients
- Whether provider recommendations changed client behavior
How it is measured
Order and payment history is cross-referenced with service, retail, and add-on activity for clients with at least five completed visits.
The hidden issue
A regular client can be highly dependable while still representing limited growth.
The salon retained these clients successfully, but transaction history showed almost no movement beyond the original service.
Meanwhile, newer clients using multiple services or purchasing retail products produced higher average tickets and greater annual value, even when visiting less frequently.
The salon was treating retention and client-value growth as if they were the same measurement.
Example findings
- Long-term regulars had never purchased retail products.
- High-frequency clients booked one service at every visit.
- Multi-service clients produced higher average tickets.
- Provider-level retail and add-on attachment varied.
- Some services created repeat visits but not broader relationships.
Illustrative financial model
| Client-value issue | Illustrative impact |
|---|---|
| Average single-service ticket | $125 |
| Average multi-service or retail-attached ticket | $164 |
| Average per-visit value difference | $39 |
| Long-term clients with no add-on or retail history | 28 clients |
| Average annual visits per client | 7.2 |
| Estimated annualized client-value gap | $7,862 |
Not every client needs another product or service. The purpose is to identify whether relevant opportunities are consistently being overlooked within established relationships.
What changed operationally
- Long-term single-service clients could receive consultation reviews.
- Providers could see natural add-on patterns for each service.
- Retail recommendations could reflect actual client needs.
- Attachment rates could be measured alongside sales.
- Stable retention could be separated from expanding LTV.
The operating lesson
Retention creates stability, but retention alone does not guarantee growth.
Adaptiv Stratum helps identify whether the salon has a retention problem, cross-selling problem, consultation problem, or provider recommendation problem.

The True Cost of “Just This Once”
When retention tactics and discounts bleed margin
Discounts and complimentary services may smooth over a problem, but repeated concessions can become a provider habit without producing stronger long-term retention.
The surface problem
Discounts were occasionally used to recover from a rough client experience, encourage a rebook, or preserve goodwill.
Each individual concession appeared reasonable. A small percentage reduction, a complimentary treatment, or an uncharged add-on did not seem material in isolation.
But over time, the pattern became concentrated around certain providers and client situations. The salon was giving away more value than the owner realized, without knowing whether those concessions actually improved retention.
What Adaptiv Stratum examined
Adaptiv Stratum reviewed discount codes, manual price adjustments, zero-dollar line items, comped add-ons, provider attribution, client history, and first-, second-, and third-visit conversion.
- Discount volume and frequency by provider
- Whether discounted new clients became full-price regulars
- Hidden margin loss from uncharged add-on services
- Retention outcomes following specific pricing concessions
How it is measured
Discount codes and manual checkout adjustments are isolated and attributed to specific providers and clients. Those clients are then compared against full-price clients using second- and third-visit conversion and future full-price behavior.
The hidden issue
A discount only protects value if it changes future client behavior.
In this composite scenario, the salon had no clear evidence that discounted new clients retained better than full-price clients. In several cohorts, discounted clients converted at a lower rate.
Some complimentary add-ons were not entered as line items, which meant the salon could not measure the service time or value being given away. Other adjustments clustered around a small number of providers, suggesting a process or confidence issue rather than a broad client-retention strategy.
Example findings
- A small number of providers created most manual discounts.
- Discounted new clients did not retain better than full-price clients.
- Comped add-ons consumed capacity without appearing in reports.
- Some regular clients began expecting recurring concessions.
- Discount reasons were inconsistent or not recorded.
Illustrative financial model
| Margin issue | Illustrative impact |
|---|---|
| Manual discounts per month | $780 |
| Estimated comped add-on value per month | $460 |
| Total monthly pricing concessions | $1,240 |
| Annualized gross revenue concession | $14,880 |
| Discounted new-client third-visit conversion | 34% |
| Full-price new-client third-visit conversion | 46% |
Gross concession value is not the same as lost profit, and not every concession is inappropriate. The analysis determines whether pricing exceptions are controlled, measurable, and tied to better future behavior.
What changed operationally
- Manual discounts could require standardized reason codes.
- Comped services could be entered as visible zero-dollar items.
- Provider-level concession patterns could be reviewed.
- Discounted clients could be tracked into future full-price visits.
- Approval limits could separate routine recovery from excessive discounting.
The operating lesson
“Just this once” becomes expensive when it is repeated, untracked, and disconnected from measurable retention.
Adaptiv Stratum helps identify whether the salon has a pricing problem, service-recovery problem, provider-coaching problem, or discount-governance problem.
Staff Performance

The Staff Member With Strong Sales but Weak Retention
Provider-level retention versus raw revenue
High sales do not always mean strong business-building performance. A provider can produce revenue while losing new clients or depending on a narrow group of regulars.
The surface problem
The salon had a staff member whose sales were strong, calendar was active, and monthly totals compared favorably with other providers.
But new clients assigned to this provider were not consistently becoming repeat clients. The provider generated revenue, but not always durable client relationships.
What Adaptiv Stratum examined
Adaptiv Stratum reviewed provider-level sales, new-client retention, service mix, repeat behavior, client concentration, first-service history, and long-term client value.
- Sales by staff member versus retained clients
- New-client retention by provider
- Client concentration risk
- Performance viewed through long-term business value
The hidden issue
High sales do not always mean strong business-building performance. A provider can generate strong monthly revenue while losing new clients or relying on a small group of regulars.
New clients were less likely to reach a third visit with this provider. A small group of loyal clients also accounted for a large share of the provider’s revenue.
The issue was not whether the provider produced sales. It was whether the provider strengthened the salon’s future client base.
Example findings
- The provider ranked high in sales but lower in retention.
- New clients frequently failed to reach a second or third visit.
- A narrow client group produced disproportionate revenue.
- Some high-ticket services created weak repeat behavior.
- Performance changed materially when measured by retained clients.
Illustrative financial model
| Provider performance issue | Illustrative impact |
|---|---|
| New clients assigned monthly | 16 |
| Provider third-visit conversion | 31% |
| Salon average third-visit conversion | 47% |
| Monthly retained-client gap | 2.6 clients |
| Estimated first-year value per retained client | $720 |
| Estimated monthly first-year value exposure | $1,872 |
| Estimated annualized value exposure | $22,464 |
This does not mean the provider underperforms in every respect. It means sales alone may not show whether durable client value is being created.
What changed operationally
- Staff performance could include client retention.
- New-client assignment could reflect provider retention strength.
- Consultation and rebooking habits could be reviewed.
- Client concentration risk could be monitored.
- Service mix could be evaluated for long-term quality.
The operating lesson
Staff performance is not fully measured by revenue alone.
Adaptiv Stratum helps identify whether the salon has a staff performance problem, provider retention problem, service-fit problem, or client concentration problem.
Which of these patterns may exist inside your business?
Adaptiv Stratum reviews the available data, identifies which questions can be answered, and prioritizes the operating issues most likely to affect revenue, retention, capacity, staff performance, and client value.