
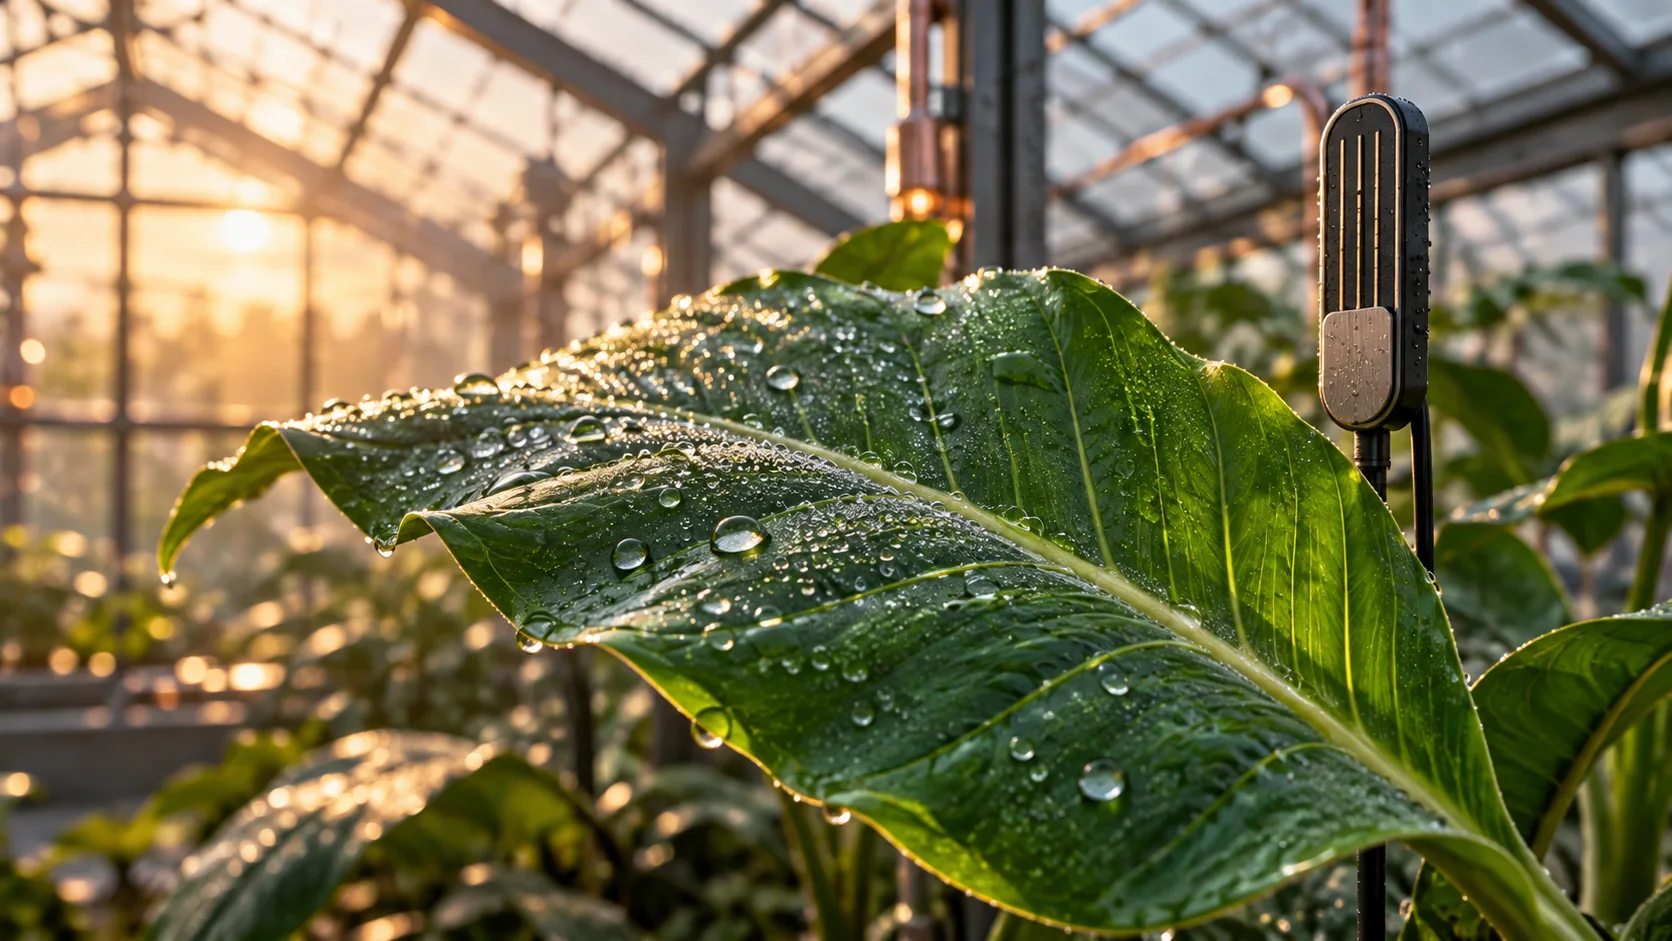
The greenhouse trend looks ordinary, yet the morning crop walk finds wet leaves near one end of the house. The central humidity probe did not necessarily fail. It may be describing a different place and surface from the one the grower needs to understand.
Investigate the wetness event itself: where it occurred, when it began, how long it was observed, and what was happening around the crop. Connect local measurements with inspection notes before changing an operating program. A room-average humidity value is not a direct observation of every leaf, and a wetness event is not by itself a disease diagnosis.
Distinguish air conditions from a wet leaf
Relative humidity describes air at the measurement location and temperature. Condensation concerns a surface and its relationship to the surrounding conditions. UMass Extension explains greenhouse condensation, including the possibility of droplets forming on cooler leaves as air conditions change.
That distinction makes the inspection question more precise. Was the surface wet, or did a probe merely report humid air? Could irrigation, dripping from a structure, or another local source explain the observation? Record those alternatives instead of calling every wet leaf condensation.
The aim is not to derive an exact leaf state from one room reading. It is to identify the evidence needed to compare a local event with the greenhouse's recorded conditions. Keep the crop, canopy position, nearby structure, and observation method attached to the record.
Define the event window before comparing days
An inspection at 7:00 a.m. establishes what the observer saw then. It does not establish that the surface was wet throughout the preceding night. If continuous wetness information matters, select and commission an appropriate method with the grower and technical team.
A leaf-wetness sensor is also a measurement arrangement with placement and interpretation limits. Its surface, orientation, exposure, and threshold behavior may not represent all crop leaves. Record configuration and check it against actual observations rather than treating a binary wet flag as unquestionable truth.
Align clocks and time zones across inspection notes, environmental systems, irrigation records, and any wetness instrument. Keep missing intervals visible. A plot that joins the last reading before a gap to the first reading afterward can make an unobserved period appear known.
- Locate the eventIdentify crop, leaf position, zone, and observed moisture.
- Align the windowConnect inspections and instruments with consistent timestamps.
- Compare explanationsRetain placement limits, gaps, and other moisture sources.
- Choose the next checkLet the grower authorize inspection or a bounded trial.
Investigate a recurring morning observation
Consider a hypothetical greenhouse where the grower notices droplets on leaves beside the north wall on several mornings. The crop-observation register becomes the event record, linked to the environmental historian rather than replacing it. Each event has a stable zone and a photo reference where appropriate.
The grower compares affected leaves with a comparable interior position, recording crop stage, inspection time, visible wetness, and nearby drips or irrigation activity. The technician documents sensor position and retrieves the relevant environmental window. A qualified crop adviser reviews the combined evidence if plant-health concerns arise.
Suppose a commissioned test arrangement reports wetness from 05:10 to 06:25, a hypothetical 75-minute interval. An inspection at 06:00 supports a local wet observation within that window. It does not validate every minute, every leaf, or a universal disease-risk threshold. A second zone has a 20-minute data gap, so its duration remains incomplete rather than being filled with a convenient estimate.
The grower decides whether another observation, an equipment review, or a bounded operating trial is warranted. If a trial changes an approved ventilation or irrigation arrangement, its authority and stop conditions are recorded separately. The data platform does not independently change climate settings because a generated summary suggests condensation.
Keep a condensation event log
Useful fields include:
- Crop context: crop and batch, stage, canopy location, zone, and relevant structural features.
- Observation: wet or dry surface, observer, time, method, photo, and inspection limitations.
- Instrument context: device, position, configuration, service state, and known gaps.
- Environmental window: local air measurements, available surface information, irrigation activity, and other plausible moisture sources.
- Review: what is known, competing explanations, the next inspection question, and the responsible grower or adviser.
Use the same observation method when comparing days, or state what changed. An inspection after sunrise cannot be directly equated with one before dawn without considering timing. Changing crop density, screen position, and irrigation schedule together also limits what a comparison can establish.
Use the record to choose a bounded next step
Conventional software can assemble time windows, preserve gaps, and display related events. AI can draft an event summary and flag a missing zone or inconsistent timestamp. It should not infer an unseen disease, invent surface-temperature observations, or prescribe a crop treatment.
Start with one repeatedly affected area and one appropriate comparison location. Ask whether the combined record helps the grower explain the next observation more clearly. Measure the completeness of event windows and whether agreed follow-ups occur, not a fabricated reduction in disease. The useful result is a better local question and an accountable decision, rather than another dashboard that reassures everyone while the crop tells a different story.
Sources & further reading
Primary references checked October 19, 2026. Examples are illustrative, not reported client outcomes.
- UMass Extension explains greenhouse condensationPrimary background for the linked discussion. Use the actual application, current product documents, and qualified review for operating or acceptance decisions.