

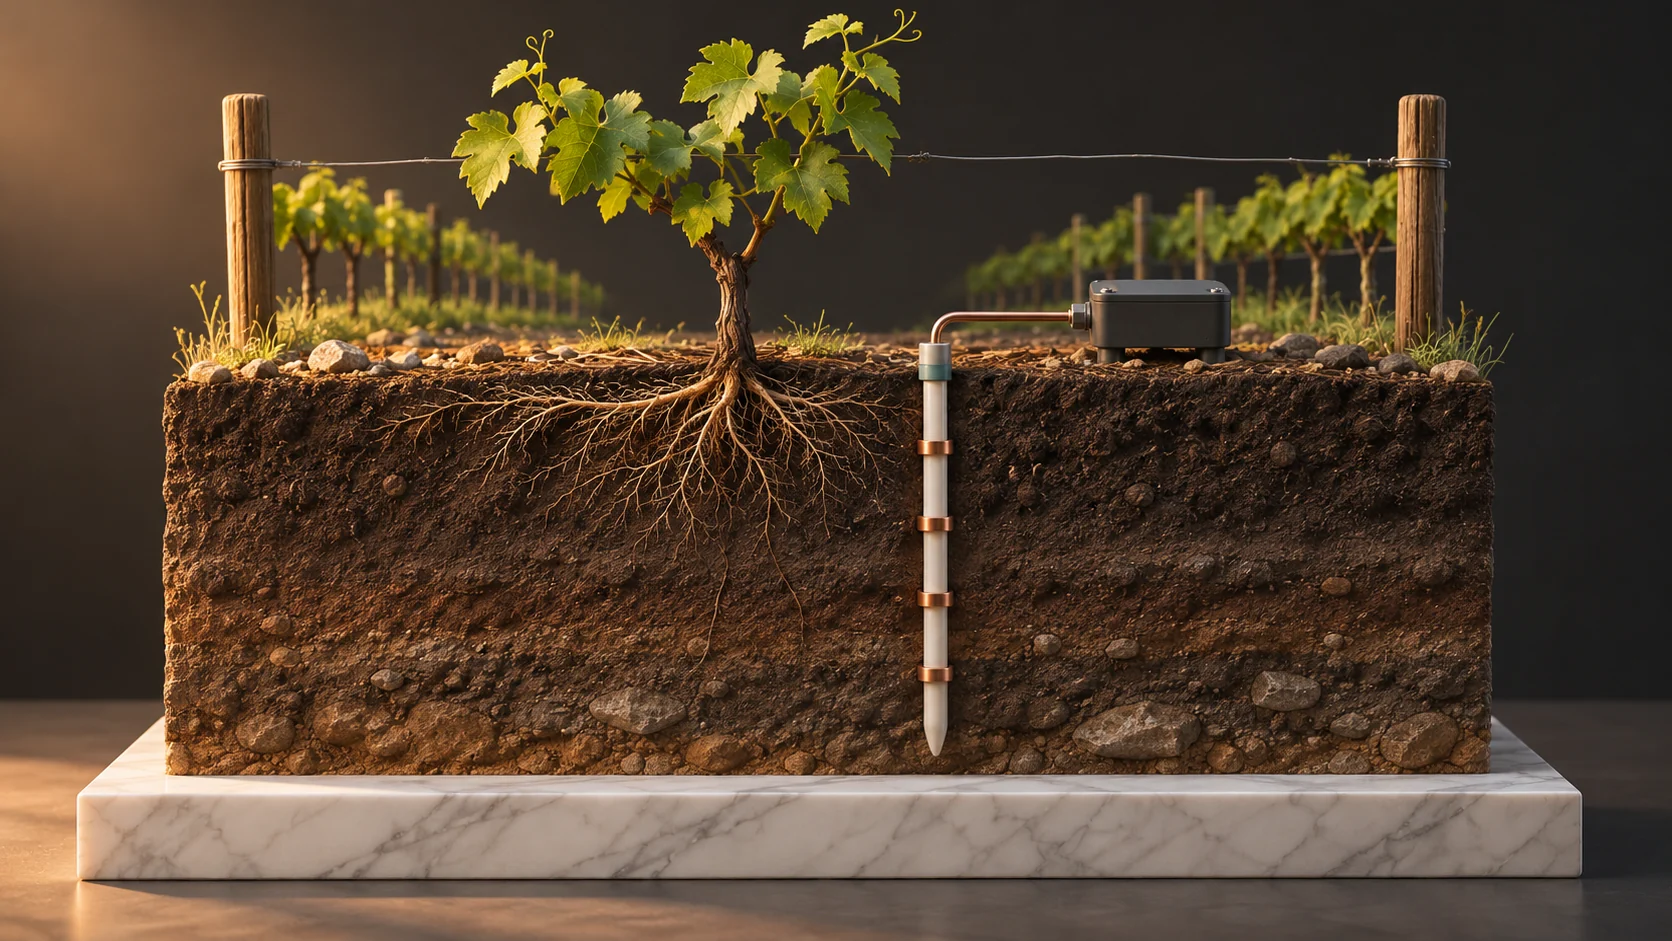
To see whether an irrigation run reached active roots, compare moisture before and after the run at several depths. Place at least one sensor where the crop takes up water and another near or just below the effective root zone. The timing of the response can show where wetting reached the probe. A deeper rise is a reason to investigate, since one point measurement cannot establish how much water or fertilizer moved beyond the roots.
This guide is for growers, irrigation managers, crop advisers and integrators working with orchard, vineyard or berry blocks. Start with a representative irrigation zone and keep the first installation advisory while you verify the readings.
Put the sensors where the crop and the water meet
Confirm effective rooting depth with the crop adviser for the crop, growth stage and soil. Root depth changes with the season and can vary within a block. University of Minnesota Extension gives one-third and two-thirds of the effective root zone as a starting point for paired sensors. Add a deeper sensor if the decision includes wetting below the active roots.
Choose locations with known soil texture, irrigation delivery and emitter spacing. Under drip, the wet bulb is three-dimensional. A probe next to the emitter may show a strong response while roots farther away remain dry. A second location at a different position in the wet bulb, or at a weaker part of the system, can explain the difference. Use representative positions for each soil or management zone rather than averaging unlike soil conditions. The Ontario irrigation guide illustrates sensor placement relative to the wetting front.
Record depth from the surface, offset from emitter and plant, soil layer, probe ID, and installation date. Follow the sensor maker’s installation method so the measuring surface contacts undisturbed soil where possible. Air gaps, smeared clay and water running down an oversized borehole can distort the profile. Test an irrigation and dry-down sequence before using the numbers to alter the schedule.
Calibrate moisture, conductivity and temperature as separate signals
- Moisture. Frequency-domain reflectometry, often called capacitance sensing, uses the soil’s effect on an oscillating measurement circuit to estimate volumetric water content (VWC). VWC is a volume fraction. For example, 0.24 m³/m³ represents 24% of the measured soil volume as water under the stated calibration. Soil texture, packing, salinity and temperature can affect the response. Compare the probe with independent samples or a validated reference at several water contents for the soils you intend to measure. Track calibration by soil and sensor depth, and repeat the check if the probe is moved. Oregon State University Extension describes the measurement and installation choices.
- Bulk electrical conductivity. Electrodes measure electrical conduction through the soil around the probe. Bulk EC can change when the soil gets wetter even if the applied solution stays the same. Texture, temperature and soluble salts also affect readings. Pore-water EC describes the water in the pores, and saturated-paste extract EC describes a laboratory preparation. A supported model may estimate one from other measurements under stated assumptions. A bulk reading alone cannot quantify fertilizer, identify nitrate or prove leaching. Compare EC at similar moisture and temperature conditions and use soil, water or drainage sampling with an adviser when the decision needs chemistry. USDA ARS research on apparent conductivity and the METER sensor manual describe these distinctions.
- Temperature. Measure it near the sensing volume if using a temperature correction. Keep the raw values, compensation method and reference temperature in the record. Compare a temperature-corrected series only within the range for which the method was tested.
For a custom four-depth probe, electrode geometry, a stable excitation and detection circuit, a reference and calibration determine whether the readings are useful. A design might use a measurement frequency around 100 MHz, but a nominal frequency alone cannot establish accuracy or compensate for cross-talk, cable effects or field installation. Use a suitable analog front end and digital interface. A microcontroller GPIO does not substitute for the FDR sensing circuit. For a first field trial, consider a documented commercial probe with a supported digital output and put the custom work into logging and interpretation.
Read one irrigation run at matched depths
In this illustrative block, the adviser estimates active roots extend to about 45 cm. Four depths are sampled at 15, 30, 45 and 65 cm. Just before a run their calibrated VWC readings are 0.18, 0.20, 0.22 and 0.23 m³/m³. Four hours later they read 0.26, 0.25, 0.23 and 0.23. The upper two depths rose by eight and five percentage points. The one-point rise at 45 cm is within this example’s field repeatability band, and the deepest reading is unchanged. The best supported conclusion is that the wetting response reached the upper and middle sensors at this site. The 45 cm response is unresolved.
The next morning, the 65 cm reading reaches 0.27 m³/m³. Check for rain, another irrigation event, local drainage or preferential flow down the installation. Compare the timing with a second probe in the same management zone. If deep responses repeat after longer runs and the root-zone response is adequate, the adviser can consider comparing a shorter run under similar conditions. A single profile cannot establish the volume lost below the root zone or the concentration of anything carried with it.
Pair every trace with measured irrigation volume or runtime and pressure where available, rainfall, and sensor health. Tag late-arriving samples with their original observation time. Plot gaps openly so a dead battery does not resemble a flat soil moisture curve.
Budget energy and radio performance at the field site
An ESP32-C3 can use a timer to wake from deep sleep, take measurements on the main processor and return to sleep. It does not have the ULP coprocessor. The ESP32-S2 supports ULP FSM and ULP RISC-V, with one active at a time. Check which low-power peripherals can actually communicate with the chosen analog front end. See Espressif’s sleep capability table and ESP32-S2 ULP guide.
Measure the installed node across sleep, sensor power-up and settling, sampling all depths, storage, transmit, receive windows and retries. For example, a 30-minute cycle with measured 25 µA for 1,798 seconds, 18 mA for 1.2 seconds, and 95 mA for 0.8 seconds averages about 79 µA, or 1.9 mAh per day. This is a budgeting example. Cold temperatures, retries, startup, regulators and battery self-discharge affect the actual result. Validate pulse current and low-temperature behavior against the battery supplier’s guidance, particularly for lithium thionyl chloride cells, and measure the assembled node rather than using the microcontroller’s sleep number alone.
The Semtech SX1262 is a separate sub-GHz radio transceiver. A LoRaWAN design also needs compatible firmware, a gateway or network service and the correct regional configuration. LoRa and Wi-Fi are separate options. Test from the final mounting height, including mature canopy, wet conditions and a gateway outage. Record locally if the link is down, then backfill by sequence and original timestamp. Choose a sampling interval that captures the rise and dry-down you need, and send summaries at a separate cadence if that saves energy without losing the event.
Prove the field pilot before changing an irrigation schedule
- Check placement and calibration. Use at least two representative locations for the trial where practical. Compare against a validated reference or independent soil sampling, and document what the adviser considers an actionable change at each depth.
- Compare matched runs. Record weather, measured water delivery, starting moisture and the depth response. Review where wetting begins, what the profile does afterward and whether the result repeats. If the deepest reading rises repeatedly, investigate the flow path before attributing the change to drainage or chemistry.
- Test missing data and recovery. Disconnect one depth, test loss of the radio link, and power-cycle the logger. Ensure a missing depth cannot be presented as a low reading or drive an irrigation change. Give the operator a visible data-health status.
- Measure the operating outcome. Compare water delivered and pumping energy from independent meter records for comparable periods, with crop and weather context. Check whether the installation reduced unanswered irrigation questions and how much maintenance it needs. Avoid carrying a change to another soil or crop without checking the assumptions again.
The first useful deliverable is a depth-by-depth record that shows which parts of the profile responded, which observations are uncertain, and what the grower should verify before changing the next run.